
Navigate your organization's Insights
Encamp's Insights dashboard provides a comprehensive overview of your organization's environmental compliance performance across multiple regulatory programs, including air, water, and waste.
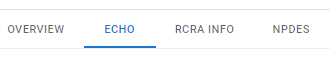
This article will guide you through the the four tabs of the Insights module (OVERVIEW, ECHO, RCRA INFO, and NPDES), to help you understand and interpret the data you see.
Access Insights
To access the Insights page for your organization, click Insights from the left-hand menu.
Note: The Insights feature must be enabled for your organization to access this functionality. All user roles except "EHS Field User" will have access to Insights.
Overview
The Overview tab provides a visualization of all your organization's compliance data from the ECHO database. The tab is organized into four interactive cards: My facilities, Penalties, Violations, and Non-Compliance.
The Overview tab is designed to be interactive - clicking on various elements will either filter the data on the rest of the page or display a filtered data table with relevant facility information.
My Facilities
This card provides an overview of all facilities in federal databases that belong to your organization.
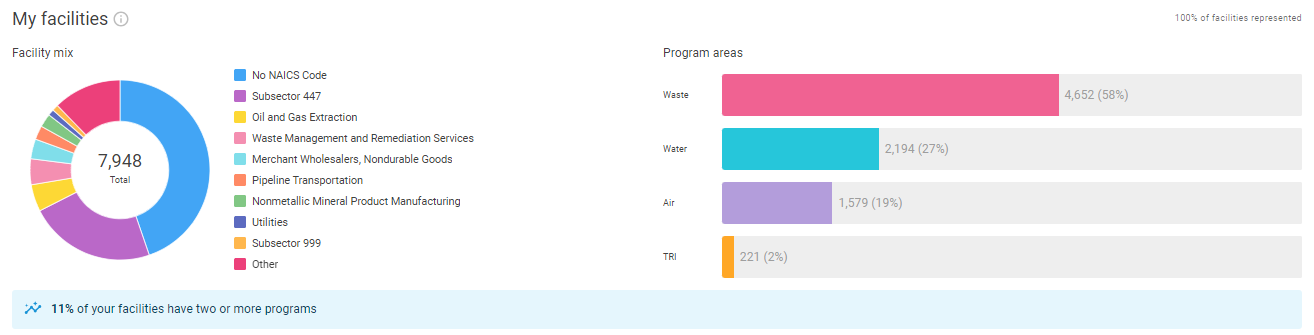
Facility mix represents your organization's facility breakdown by industry. In this chart, facilities have been grouped based on the first 3 digits of their primary NAICS code. The top 10 NAICS codes present in your organization are shown.
Program areas shows your facility breakdown by program type. The count and percentage display the number of facilities that have a federally-recognizable compliance posture in each program area. Facilities can be counted in more than one program area. Note that facilities that may have involvement in a program area at a local level only (e.g., a municipal wastewater permit) may not be reflected in these totals.
% of facilities represented displays the ratio of facilities accounted for in Insights against the number of facilities your organization has in Encamp.
Clicking on any industry category and/or program area will filter the data on the rest of the page. To undo a filter, click the category or program area again.
Penalties
The Penalties card provides an overview of financial penalties incurred due to environmental compliance issues over the last three years.
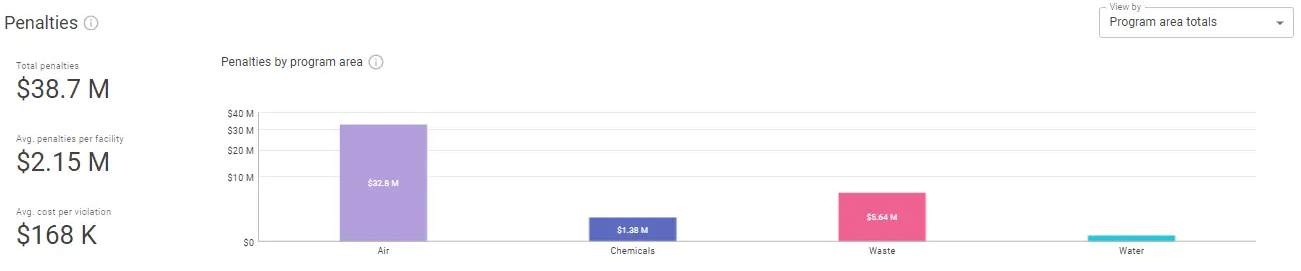
Total penalties shows the aggregate amount of penalties paid by your organization across all program areas.
Avg. penalties per facility displays the average penalty amount per facility within your organization.
Avg. cost per violation represents the average financial impact of each violation.
You can view the following different graphs about penalties by toggling the View by dropdown:
Program area totals: Shows the total penalties paid over the last 3 years, broken down by program area.
Quarterly totals: Displays the total penalties paid during each quarter over the last 3 years.
Quarterly by program area: Represents the penalties paid each quarter over the last 3 years, broken down by program areas.
Costliest facilities: Lists the facilities that have incurred the highest total penalties over the last 3 years.
If there is a penalty against multiple facilities, you'll see that penalty represented in full on each corresponding facility (e.g. a single $10k penalty would be added to both facility X and Y).
Clicking on any representation in the charts will take you to appropriately filtered data table. For example, clicking on the 2022Q3 column in the "Penalties by quarter" graph will direct you to a table that shows the facilities that incurred a penalty in that quarter.
Violations
The Violations card provides insights into the number and nature of environmental violations across your organization.
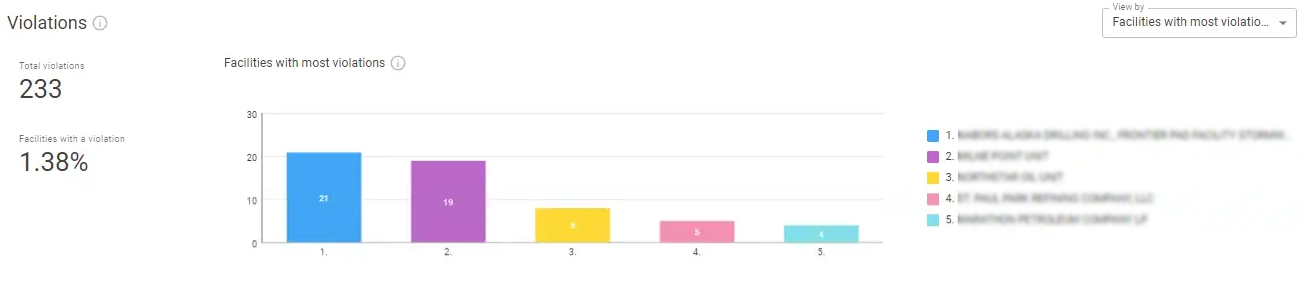
Total violations shows the aggregate number of violations recorded for your organization.
Facilities with a violation displays the percentage of your facilities that have had at least one violation.
Facilities with most violations is a bar chart showing the top facilities with the highest number of violations.
You can view the following different graphs about penalties by toggling the View by dropdown:
Program area totals: Shows the total number of violations over the last 3 years, broken down by program areas.
Quarterly totals: Displays the total number of violations during each quarter over the last 3 years.
Quarterly by program area: Represents the number of violations each quarter over the last 3 years, broken down by program areas.
Facilities with most violations: Lists the facilities with the highest number of violations over the last 3 years.
Note: If a violation affects multiple program areas, it will be represented in each corresponding program area total, but it's only counted once in the overall 'total violation' count.
Clicking on any representation in the charts will take you to appropriately filtered data table. For example, clicking on the Water column in the "Number of violations by program area" graph will direct you to a table that shows the facilities that have had water violations in the last 3 years and the count of violations for each facility.
Non-Compliance
Quarterly non-compliance by program area is a stacked bar chart showing the number of facilities in non-compliance for each quarter over the past three years, color-coded by program area.
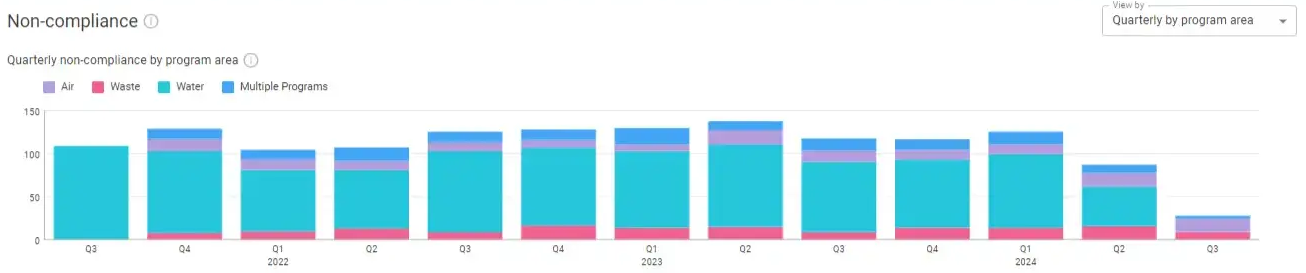
You can view the following different graphs about penalties by toggling the View by dropdown:
Program area totals: Shows the total number of facilities in non-compliance for at least one quarter over the last 3 years, broken down by program area.
Quarterly totals: Displays the total number of facilities in non-compliance during each quarter over the last 3 years.
Quarterly by program area: Represents the number of facilities in non-compliance each quarter over the last 3 years, broken down by program area.
Least-compliant facilities: Lists the facilities that have spent the most quarters in non-compliance across all program areas over the last 3 years.
Note: If a facility is in non-compliance in multiple program areas, it will be counted against each corresponding program area total.
Clicking on any representation in the charts will take you to an appropriately filtered data table. For example, clicking on the top-ranked facility column in the "Least-compliant facilities" graph will direct you to a table that contains that facility.
Facility Lists by Federal Database
To view information and facility lists by each of the three federal databases, click the corresponding tab.
Note: Within each of these facility lists, if you would like to access more detailed information about a specific facility, click on the row. For more information on navigating the facility-specific Insights page, refer to the View a Specific Facility's Insights article.
"Only show my facilities" toggle
By default, the lists will be filtered to display only your organization's facilities. To view a list of all facilities in the ECHO database, turn off the "Only show my facilities" toggle, located above the search bar.
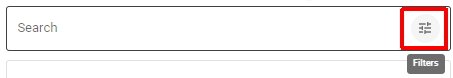
Filtering and Sorting the Facility List
You can filter or sort any of the facility lists based on various criteria, enabling you to quickly find facilities of interest. To filter the list, To sort the list, click on the header row of each column. To filter the list, click the filter button in the search bar.
ECHO
The ECHO tab allows you to explore facilities in the EPA's Enforcement and Compliance History Online (ECHO) database.
Read more about ECHO in the Glossary of Terms or on EPA's website.
Facility List

The list provides key information about each facility, including:
Registry ID: A unique identifier assigned to the facility in the ECHO database.
Facility Name: The name of the facility as listed in the ECHO database.
Address: The physical location of the facility.
Active: Indicates whether the facility is currently active in the ECHO database.
Qtrs With NC: The number of quarters in the last three years (12 quarters) that the facility was marked as out of compliance.
Note: CAA stands for Clean Air Act (i.e., Air as referenced throughout Insights), CWA stands for Clean Water Act (i.e., Water), and RCRA stands for Resource Conservation and Recovery Act (i.e., Waste).Air/Water/Waste: Indicates whether the facility is active in each of these environmental program areas.
RCRA INFO
The RCRA INFO tab allows you to explore facilities in the EPA's RCRAInfo database. RCRAInfo is a national program management and inventory system about hazardous waste handlers.
Read more about RCRAInfo in the Glossary of Terms or on EPA's website.
Facility List

The list provides key information about each facility, including:
EPA ID: The unique EPA identification number assigned to the facility.
State: The state where the facility is located.
Handler Name: The name of the facility as listed in the RCRAInfo database.
Address: The physical location of the facility.
Owner Name: The name of the facility's listed owner.
Operator Name: The name of the facility's listed operator.
Contact Email: The email address of the facility's primary contact.
Federal Waste Generator: The facility's hazardous waste generator status (e.g., Large Quantity Generator, Small Quantity Generator).
NPDES
The NPDES tab allows you to explore facilities in the EPA's Integrated Compliance Information System National Pollutant Discharge Elimination System (ICIS-NPDES) database. ICIS-NPDES contains data to track compliance and enforcement of facilities regulated by the NPDES under the Clean Water Act.
Read more about the NPDES database in the Glossary of Terms or on EPA's website.
Facility List

The list provides key information about each facility, including:
Registry ID: The number assigned by the Facility Registry Service (FRS) that is used to associate facility records from multiple environmental database systems that are known or believed to represent the same facility.
NPDES ID: The unique identification number which typically represents the permit number.
Facility Name: The name of the facility as listed in the NPDES database.
Address: The physical location of the facility.